Analyze drug-target-disease relationship for sunitinib and sorafenib by combining their
inhibition profiles with kinase disease associations of two common cancer types; namely, thyroid and colon carcinomas.
Steps
Switch to the panel
Select from the Data Source dropdown
and set the Data Type to
In the Disease dropdown, find thyroid carcinoma and click the
button
Note the creation of a new Data source in the table below,
and the addition of the corresponding annotations to the kinome tree on the right
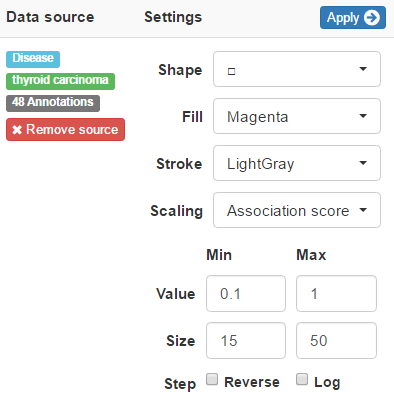
Modify the settings of the thyroid carcinoma data source as follows and click
Shape
square
Fill
RoyalBlue
Stroke
None
Scaling
Fixed
Size
18
Back in the Disease dropdown, find colonic neoplasm and click the
button
Modify the settings of the colonic neoplasm data source as follows and click
Shape
square
Fill
FireBrick
Stroke
None
Scaling
Fixed
Size
12
To start adding biochemical data, go up and select from the Data Source dropdown
and set the Data Type to
In the Karaman et al., 2008 dropdown, find sorafenib and click the
button
Modify the settings of the sorafenib data source as follows and click
Shape
circle
Fill
DarkOrange
Stroke
Black
Scaling
Kd(nM)
Value
10 to 10000
Size
30 to 80
Step
☑ Reverse ☑ Log
Back in the Karaman et al., 2008 dropdown, find sunitinib and click the
button
Modify the settings of the sunitinib data source as follows and click
Shape
circle
Fill
LightGoldenRodYellow
Stroke
Black
Scaling
Kd(nM)
Value
10 to 10000
Size
32 to 82 (slightly larger than sorafenib so that circles do no overlap)
Step
☑ Reverse ☑ Log
Go to the Download
dropdown menu to save the annotated tree, e.g. as CSV for future use
or export it as high-resolution PNG
Tutorial 2: Overview of the available human kinome data
Purpose
Get an overview of the current structural and biochemical coverage of the human kinome,
including the distribution of primary targets of clinically approved kinase inhibitors.
Steps
Switch to the panel
To add structural data counts, select from the Data Source dropdown
and set the Data Type to
Click the button
Modify the settings of the Number of PDBs data source as follows and click
Shape
circle
Fill
Crimson
Stroke
Black
Scaling
# PDBs
Value
1 to 50
Size
26 to 71
Step
☐ Reverse ☑ Log
Now to add biochemical data counts, go up and select from the Data Source dropdown
and set the Data Type to
Click the button
Modify the settings of the Number of assays in ChEMBL data source as follows and click
Shape
circle
Fill
CornflowerBlue
Stroke
Black
Scaling
# assay points
Value
100 to 3000
Size
23 to 68
Step
☐ Reverse ☑ Log
To annotate kinases which are primary targets of approved drugs,
select from the Data Source dropdown
and set the Data Type to
Modify the settings of the Key target of approved drugs data source as follows and click
Shape
triagnle
Fill
Chartreuse
Stroke
Black
Scaling
Fixed
Size
26
Go to the Download
dropdown menu to save the annotated tree, e.g. as CSV for future use
or export it as high-resolution PNG